The Ultimate Guide to Basal Body Temperature Charting for Fertility Tracking

The Ultimate Guide to Basal Body Temperature Charting for Fertility Tracking
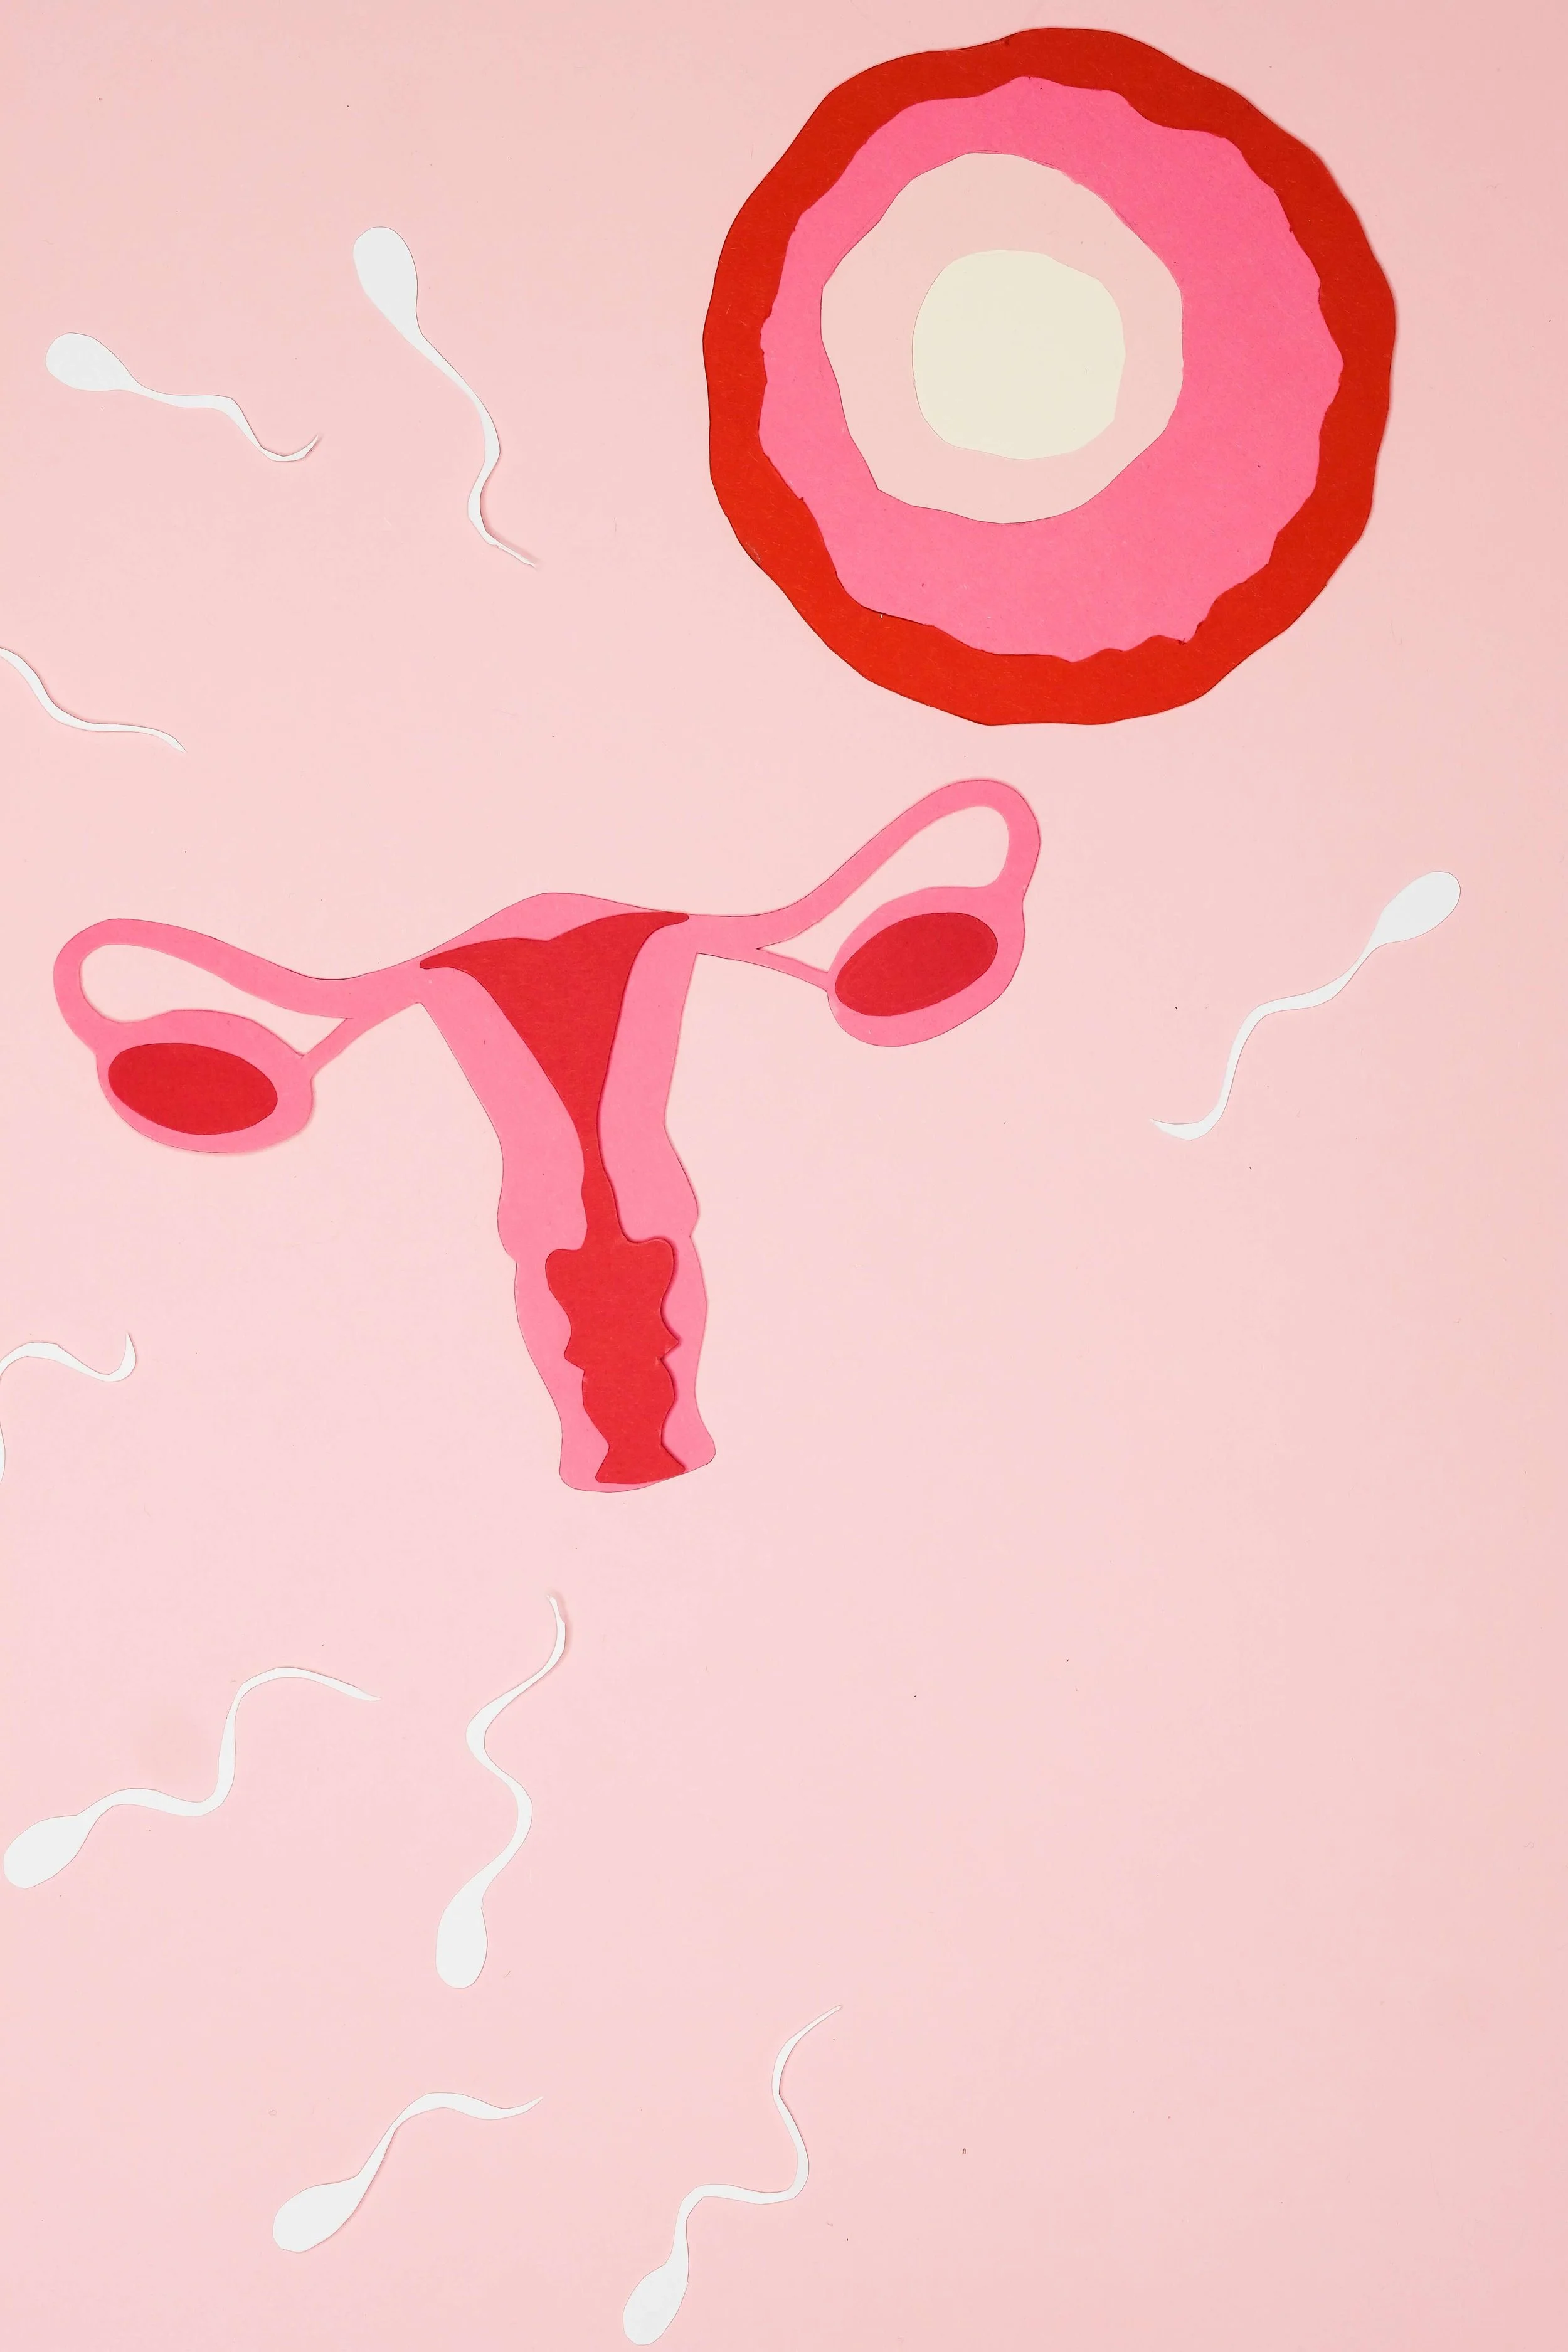
What is basal body temperature charting (BBT) and why is it important for fertility tracking?
Basal body temperature (BBT) refers to the body's lowest resting temperature, which is typically measured in the morning upon waking, before getting out of bed.
Tracking basal body temperature can be very useful for fertility monitoring and understanding your own menstrual cycle. The menstrual cycle is divided into four phases: menstruation, follicular phase, ovulation and luteal phase. The two phases important for BBT charting are: the follicular phase and the luteal phase. The transition between these phases is marked by ovulation, which is the release of an egg from the ovaries.
During the follicular phase, which occurs before ovulation, the body prepares for potential fertilisation by increasing levels of estrogen. This generally leads to a slightly lower BBT. After ovulation, during the luteal phase, the hormone progesterone is released. Progesterone is a heat-inducing hormone causing a rise in BBT.
By consistently measuring and recording basal body temperature over several menstrual cycles, patterns can emerge that help predict ovulation. A significant drop in BBT followed by a noticeable rise indicates that ovulation has likely occurred. This information can be valuable if you are trying to conceive or those who wish to avoid pregnancy by identifying fertile and non-fertile days within their cycle.
Understanding Basal Body Temperature
Basal Body Temperature (BBT) is the body’s lowest resting temperature, which is typically measured when a person is at complete rest, especially after a night’s sleep. BBT is measured first thing in the morning, ideally at the same time every day to ensure consistency. The best way to measure BBT is orally. You will need to purchase a basal thermometer designed for this purpose. As soon as you wake up, before you get out of bed or talk, place the thermometer under your tongue and take the reading. A typical BBT temperature for a woman in her follicular phase, BEFORE ovulation is around 36.1 to 36.4 degrees Celsius (97.0 to 97.5 degrees Fahrenheit). After ovulation has occurred, when the hormone progesterone is released, your BBT tends to rise slightly and will remain elevated until the next menstrual cycle or will remain elevated if pregnancy has occurred. During the luteal phase, AFTER ovulation a typical BBT temperature is 36.4 to 37.0 degrees Celsius (97.6 to 98.6 degrees Fahrenheit) . These temperatures are average values which is why it’s important to take readings over several months to see what is typical for you. BBT can be influenced by a number of factors including poor sleep, illness, alcohol consumption and certain medications, which may cause fluctuations in temperature readings.
How to chart your Basal Body Temperature (BBT)
Get a Basal Thermometer: Purchase a basal body temperature thermometer specifically designed for tracking subtle temperature changes. Regular fever thermometers may not be as accurate for this purpose.
Choose a method and recording format: There are different ways you can chart your results. You can either use an app where you can record your measurements. However, I feel like we spend so much time on our phones and its quite sensitive and personal data which is why I prefer paper charting. There is something about recording your measurements by putting pen to paper that’s quite satisfying. This is why I have created a simple chart that you can use to start recording your measurements. Download your free BBT chart here.
Establish a Baseline: Before starting BBT charting, take your temperature for a few days to establish a baseline. This will give you a sense of your typical pre-ovulation temperatures.
Begin Charting Early in the Morning: Take your temperature at the same time every morning, right after waking up and before engaging in any activity. Consistency in timing is crucial for accurate results.
Record Your Temperature: Write down your temperature every day. Include the date and time of measurement.
Observe Additional Signs: While BBT charting is useful on its own, combining it with other fertility awareness methods, such as cervical mucus monitoring or ovulation predictor kits, can provide a more comprehensive view of your menstrual cycle and fertile window.
Interpreting your Basal Body Temperature Chart
Understanding the patterns and trends in your chart will provide you with valuable insights into your menstrual cycle and fertility. You will need to have tracked your cycle over several months so you have enough data to analyse the results. Here is how to read and analyse your BBT chart:
Identify the Baseline: Observe the BBT readings during the first half of your cycle (the follicular phase). This will establish your baseline temperatures before ovulation occurs.
Notice the Temperature Shift: Look for a noticeable increase in temperature following ovulation. This temperature shift occurs due to the hormone progesterone and indicates that ovulation has taken place.
After the temperature shift, note how long the elevated temperatures persist. This is the luteal phase and typically lasts around 10 to 16 days. A shorter luteal phase may indicate a potential issue which we can investigate further.
Note the Menstrual Period: The luteal phase ends with the onset of menstruation. You'll see a drop in BBT just before your period starts or if pregnancy has occurred progesterone levels will not dip.
Once you have plotted your measurements your will be able to draw a line linking them all and will be able to identify the point of ovulation which will be the day before you see the rise.
Conclusion:
Remember that BBT charting is a tool for understanding your fertility patterns, and it may not be suitable for everyone, especially those with irregular cycles or underlying health conditions. Whilst BBT charting is useful, it can sometimes cause unnecessary anxiety. Trying for a baby can be stressful as it is so if you find this starts to get too much just stop. Interpret your BBT chart as part of a broader picture, and use it in conjunction with other fertility tracking methods for more accurate predictions such as cervical mucus monitoring and ovulation test kits.
If you want to start BBT charting then make sure to download my chart.
All you need to do is print this off and you can start monitoring your BBT and cervical mucus so you can time sex accordingly to maximise your chances of pregnancy.

Hi, I’m Raquel
I am a fertility nutritionist based in Manchester, covering the North West, Cheshire and further afield. I help couples and single women to optimise their fertility through diet and lifestyle to help them get pregnant.